THE WIDE WORLD OF
Future-Focused Reporting
We don’t look at reporting as an item on the to-do list, we see it as a labor of love: a chance to connect with our clients and help them tell their stories, tailored to their needs, objectives, and audience.
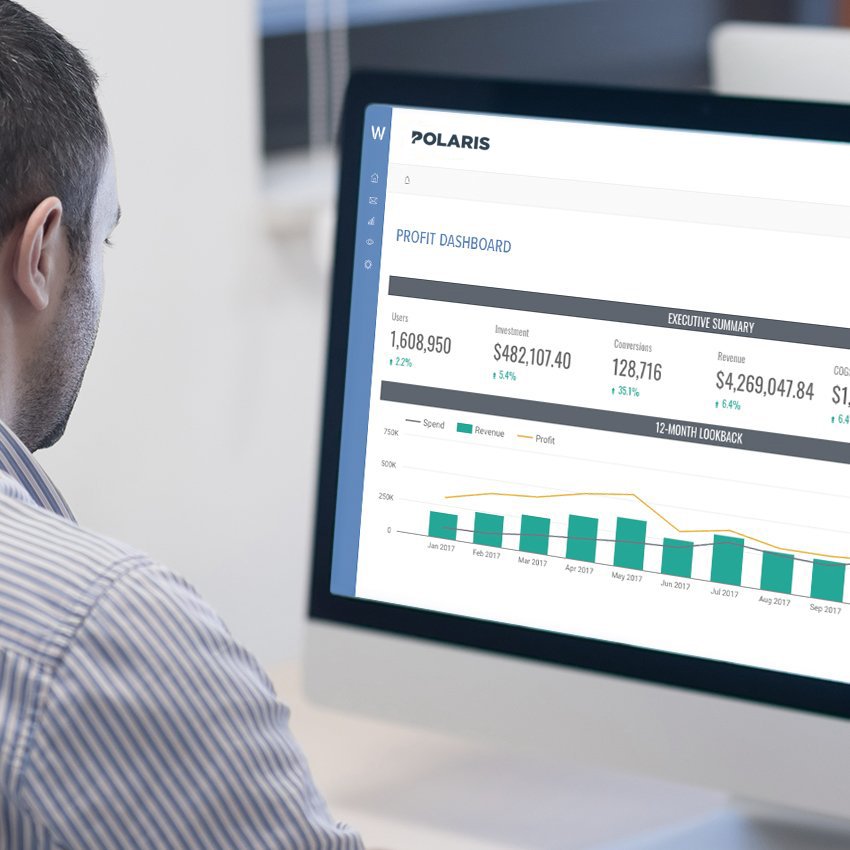
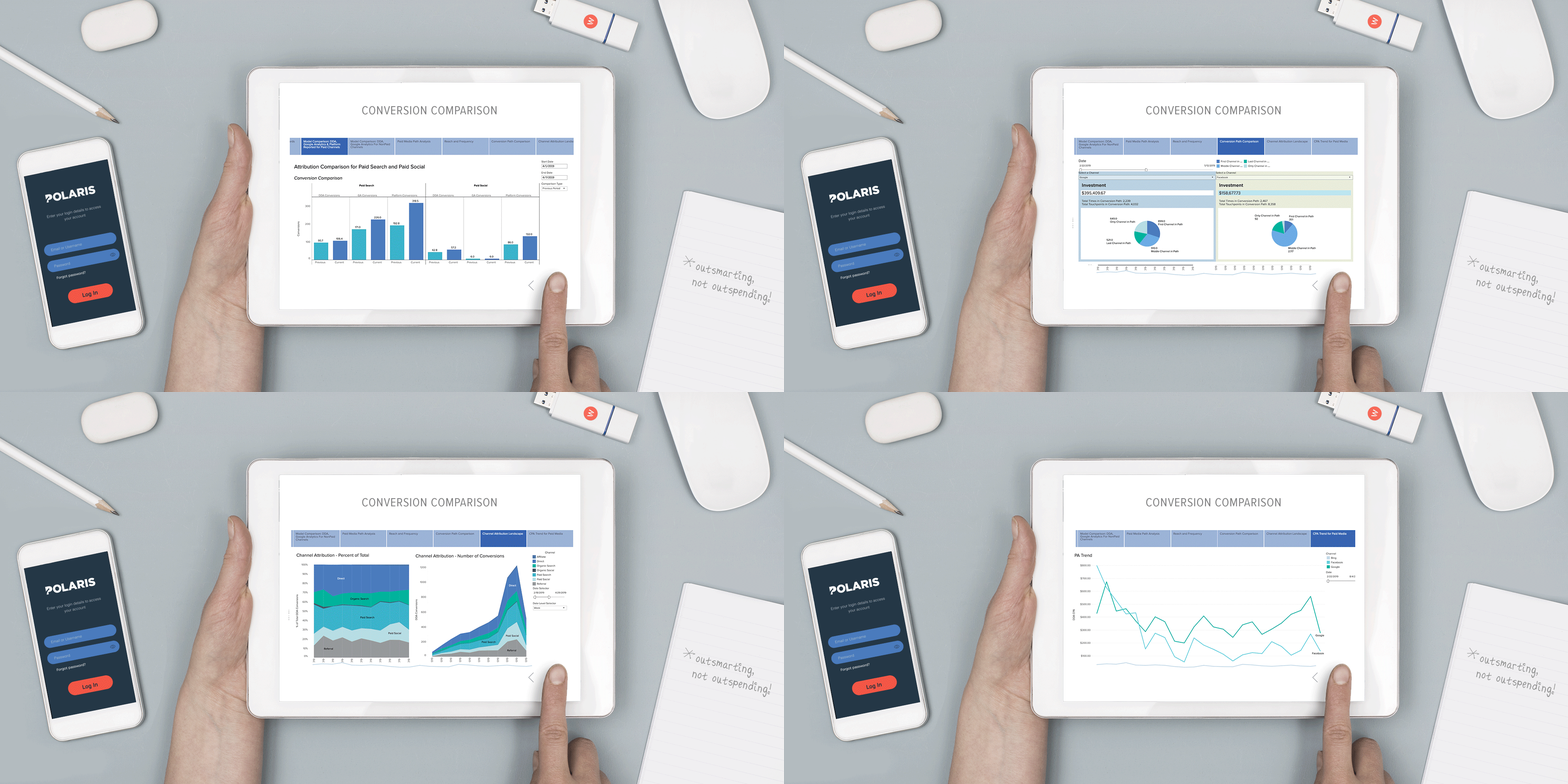
On-Demand Dashboards
We’ve got your back on a daily basis: access your data 24/7 through our customized interactive dashboards, from high-level business insights to granular platform-level data.
Quarterly Business Reviews (QBR)
We look to the big picture through our C-level quarterly presentations, incorporating industry trends, a state of the union on your progress toward goals, planning and timelines, and more.
Monthly Executive Summaries
We make sure your strategy is on track with month-over-month comparative data reports, detailed analysis and insights, testing results, and opportunities for iteration and experimentation.
Weekly Reports
We build the reporting you need to stay focused on what’s important with our automated, data-focused weekly reports, customized for your business priorities.

