In the vast data wonderland that is Google Analytics (GA), there are many tools, settings, and functions you can employ to see, understand, and customize your data consumption. One good example is the use of Google Analytics Dashboards. GA Dashboards allow you quick access to data views. They also provide an easy, fast way to create charts and other visual ways of looking at data. Continue reading for step-by-step instructions for implementing and utilizing Google Analytics Dashboards to their full advantage.
Implementing Dashboards
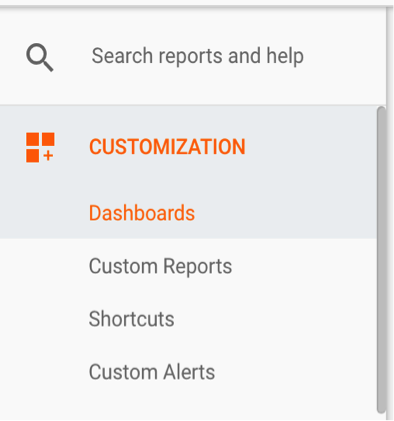
- On the navigation pane on the left of Analytics, click on “Customization” and then “Dashboards”.
- Select one of the options and name your dashboard.
- Blank Canvas will have nothing in there.
- Started Dashboard will have presets by Google.
- And in the bottom right corner of the menu, there is Import from Gallery, which lets you download community templates made by other users (this can download shared reports and segments as well).

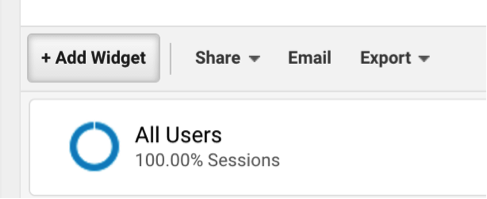
- For training purposes, let’s assume you created a blank canvas. On the top of the Dashboard interface, click “+ Add Widget.”
- Select the type of data visualization you would like to use (each will have its own set of required metrics and dimensions). Now let’s create a table.
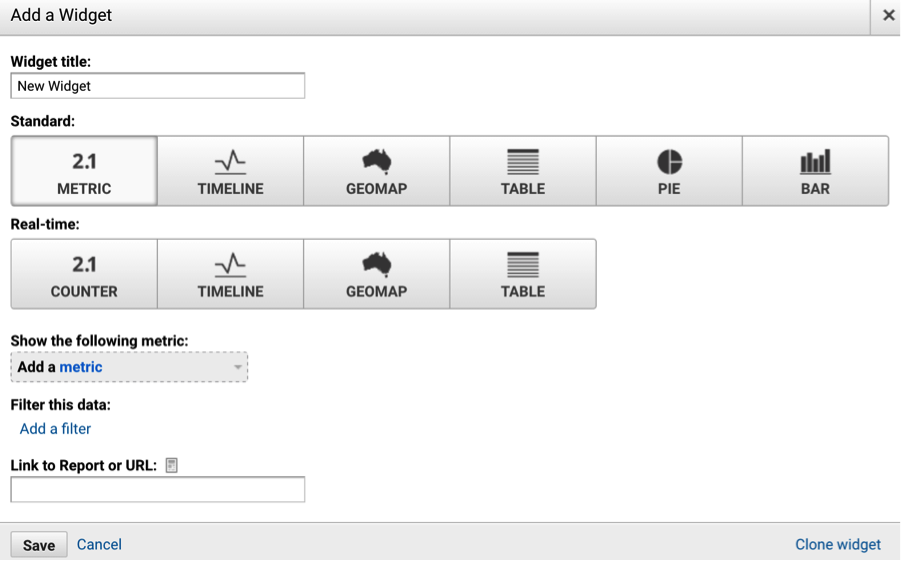
- Click “Add a dimension,” then create a table that lists goals by day.
- A metric is the numerical measurement, whereas the dimension is the non-numerical measurement. If you think about it as a table, the dimension will be the row and the metric will be the columns. For example, a metric could be something like sessions while a dimension could be a device.
- There are many metrics to choose from. In the beginning, it might be a good idea to go through this area manually, using the search function to familiarize yourself with all the available metrics and dimensions.
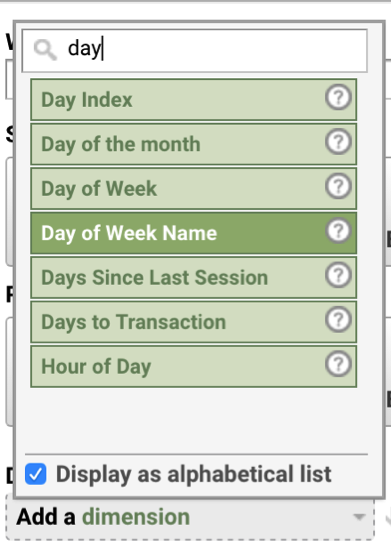
- Once you are all set, click “Add a metric.” The first metric will be what it is sorted by. There will also be a plethora of Goal metrics, but focus on the text in parentheses.
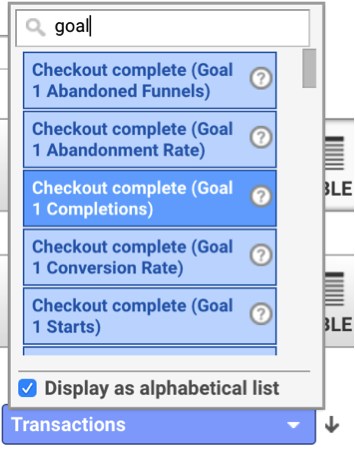
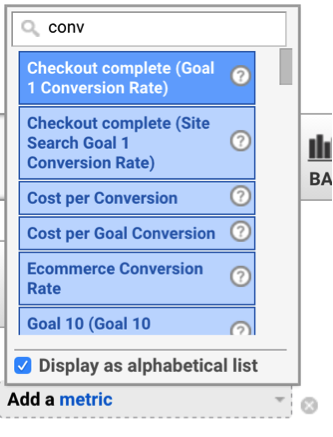
- You can add another metric, if so inclined. For instance, let’s add conversion rate. You can remove it by clicking the “x” if you no longer want it after this.
- If you’re looking for very specific data, you can filter through results by clicking “Add a filter.”
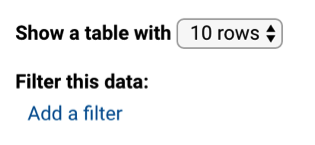
- Here you’ll have to add a dimension to the filter and the condition. For right now let’s look at SEO conversions only.
- You can do this with “Default Channel Grouping” or “Source / Medium” or “Source” or “Medium.”
- All of these have their own use, but note that Default Channel Grouping lumps everything together. So if, for instance, you want to segment out Bing, you might want to use one of the latter methods.


- Save and enjoy your graph! You can click the pencil on the top right corner of the graph if you need to make any changes to it after the fact.
Sending & Sharing Dashboards
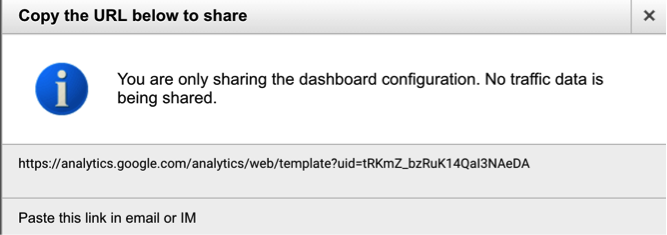
Excited about your Dashboard and want to share it with people? Click “Share” on the top of the Dashboard interface. Then either pick “Share Object” or “Share template link.”
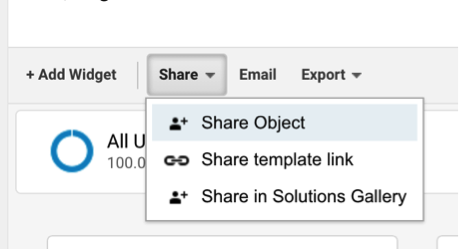
Sharing the Object will move the report from “Private” to “Shared,” allowing users in your account to see it. This is useful for Analytics savvy clients and shared accounts.

Sharing the template link will also allow you to send a link to someone even if they aren’t in your account. This is a useful way for sharing info with your colleagues, as the link will let them download the template (data not included).
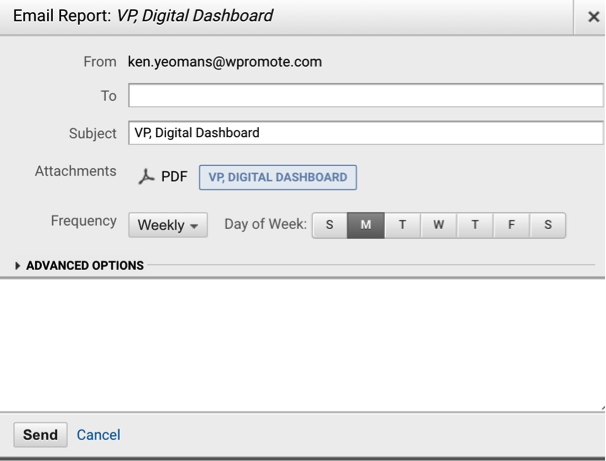
You can also schedule emails so that this info is sent out to certain receivers regularly. Just click “Email” at the top of the Dashboard Interface then fill out the fields. Note, the frequency will be how often this email will recur.
Dashboards & More
Google Analytics Dashboards provide you with a simple and quick way to create great data visualizations that are shareable and customized. However, it is not the only tool within Google Analytics that can make your data analysis and consumption easier. Check back on Girl vs. Internet blogs for more tools and tricks in the GA universe soon!


Responses